Potential-induced degradation (PID) is a shunt-path problem: leakage current from the cells to the grounded frame (through the encapsulant, under humidity and a negative cell-to-frame bias) opens up a parallel low-resistance path across each cell. Electrically, that shows up in the single-diode model as a collapsing shunt resistance, R_sh. The keypoints do not all drop together.
That distinction matters for how you read the curve. A module that has simply aged per its warranty schedule loses Isc, Vmp, and Voc together, in roughly the proportions the datasheet predicts. A module with a developing shunt path loses Fill Factor disproportionately, while Isc and Voc barely move, because the leakage current only dominates near short-circuit, where the diode's own current is small enough for a parallel low-resistance path to matter.
What it looks like on the curve
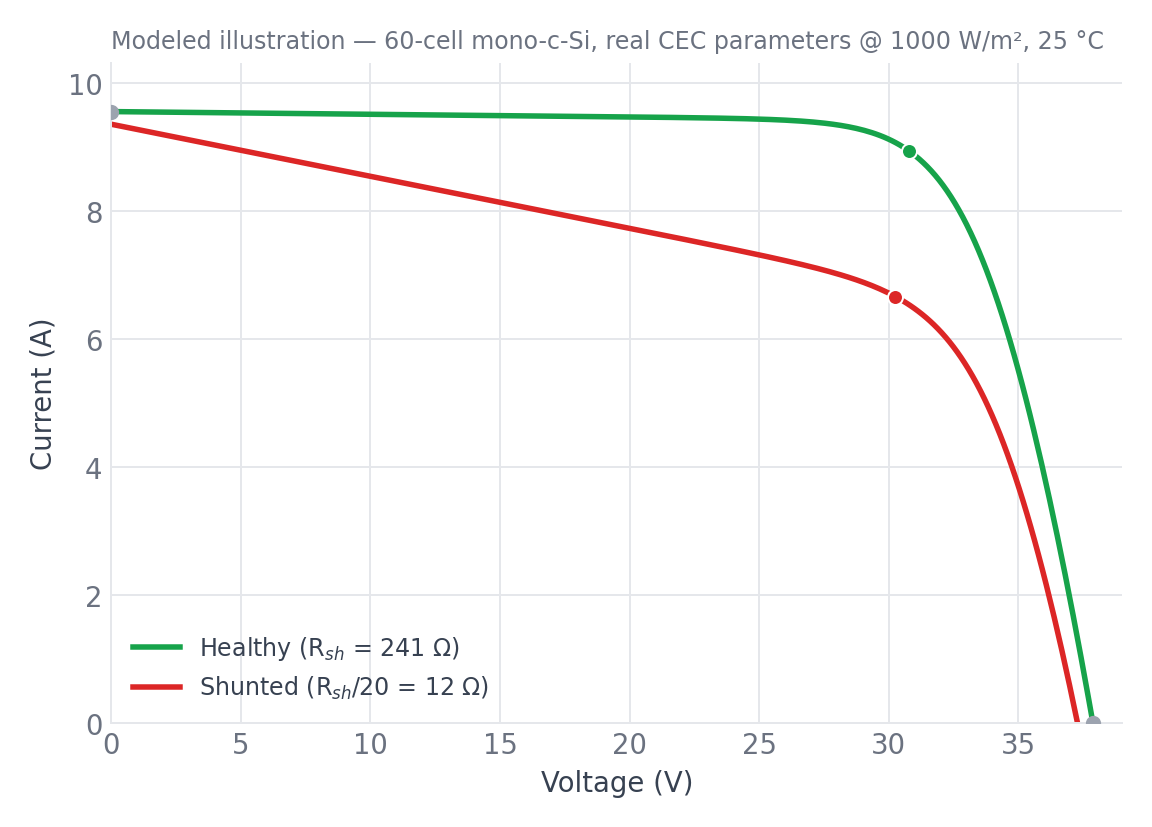
The healthy curve (green) holds nearly flat current from V = 0 out past 80% of Voc. That flat plateau is what a high shunt resistance looks like. The shunted curve (red) droops from the very first point: current bleeds away almost linearly with voltage across the whole low-voltage region, well before the series-resistance knee near Voc even starts to bend the curve over.
In this modeled case, dropping R_sh to 1/20 of its reference value costs the module roughly 20 points of Fill Factor (76.0% → 56.5%) while Voc and Isc each move by under 2%. That lopsided signature (big FF loss, small keypoint-ratio loss) is the tell.
The shape feature: slope near Isc
Besides comparing Pmp to a threshold, PV Ivy's IV Data Analyzer fits the local slope of the curve over the first 20% of Voc and compares it against the same region on the modeled curve at the same conditions. A healthy module's near-Isc slope is close to zero: the curve is current-source-like there. A developing shunt path steepens that slope measurably before Fill Factor loss is even large enough to fail a simple power threshold.
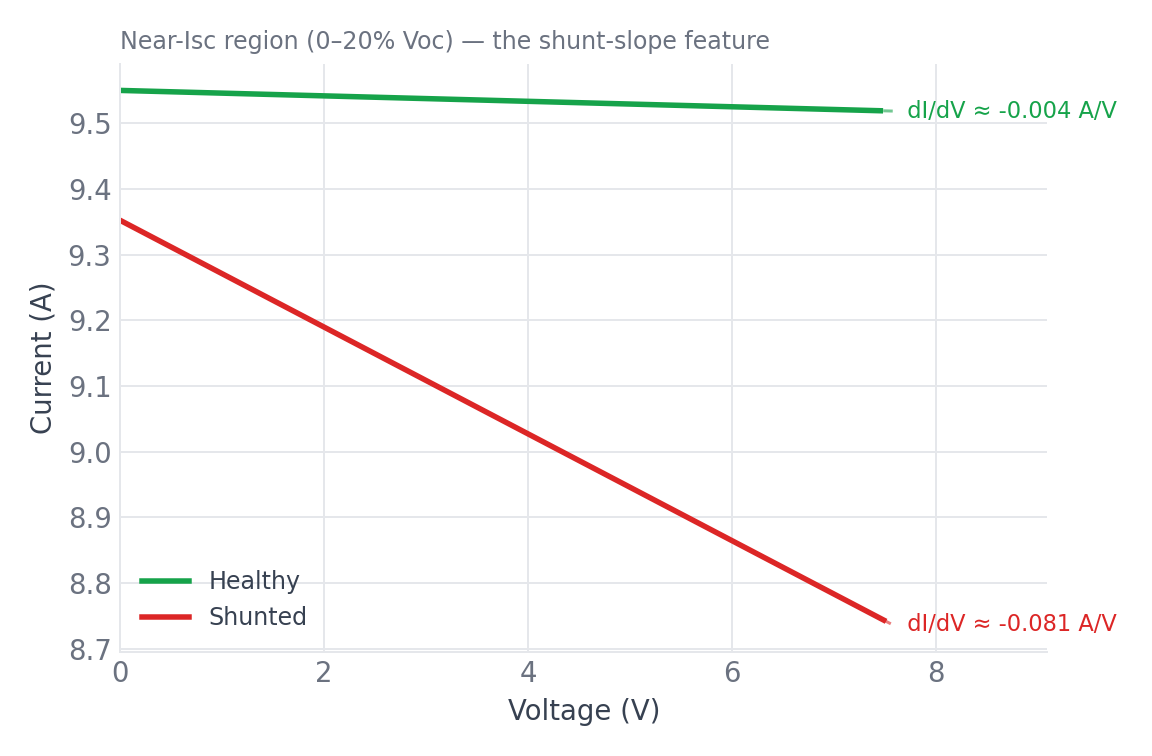
The engine compares that slope with the same module's modeled curve at the measured irradiance and temperature. A fixed threshold would not work, because a sunny, hot measurement has a different near-Isc slope than a cool, overcast one.
Retest, or actionable?
The engine is deliberately conservative about calling this out. It only proposes a shunt/PID finding when:
- the near-Isc slope has steepened well beyond the modeled healthy curve at those conditions,
- Voc and Isc ratios stay close to 1.0 (ruling out uniform degradation or a soiling/irradiance problem, which would move Isc instead), and
- confidence clears the 0.5 floor with no conflicting top candidate.
If irradiance was below the 700 W/m² that IEC 61829 recommends, or the two candidate causes are close in confidence, the result is Indeterminate/Retest rather than a forced call. Full curves under stable, in-range conditions are what let the slope comparison mean something. The figure below sweeps Fill Factor against remaining shunt resistance across a full range, beyond the single R_sh/20 case shown above:
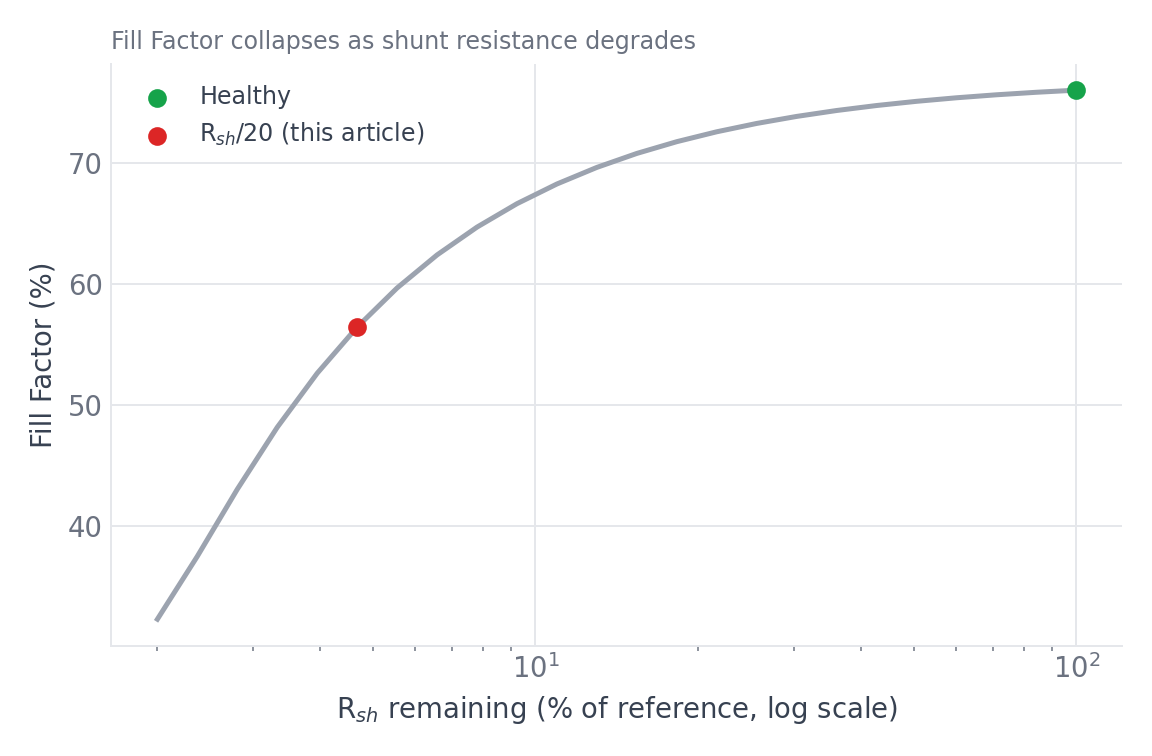
Notice the curve is non-linear: Fill Factor holds up reasonably well down to roughly 20–30% of reference R_sh, then falls sharply. That is also why a shunt problem can look like "it was fine last quarter" right up until a monitoring alert trips. Catching the slope change before FF drops below a pass/fail threshold is the point of tracking shape features at all.
Reproduce it
- Open PV Explorer, pick any module, and note its modeled curve at your site's conditions as the baseline.
- Paste a field-measured or flash-test V/I curve into Add measured data to see the same near-Isc droop directly against the modeled reference.
- For a full write-up (validation flags, IEC 60891 STC translation, and the rule-based diagnosis with confidence and evidence), run the same curve through the IV Data Analyzer.