Series resistance is the fault field crews find most often and name least often. Corroded connectors, a loose lug in a combiner, cracked cell metallization and fatigued solder bonds all add resistance in the current path. None of them shows on a thermal camera until it is bad, and none of them changes Isc or Voc. What changes is the knee of the IV curve.
Most published examples of this are simulated. This one is measured. The OptimalPV team at Tampere University put a NAPS NP190GK module on an outdoor test stand and traced it on sunny days, then repeated the runs with a known resistor wired in series: 0.22, 0.47 and 0.69 ohm. That gives real curves, with real sensors and real tracer noise, where the size of the fault is known to two decimal places.
The curves
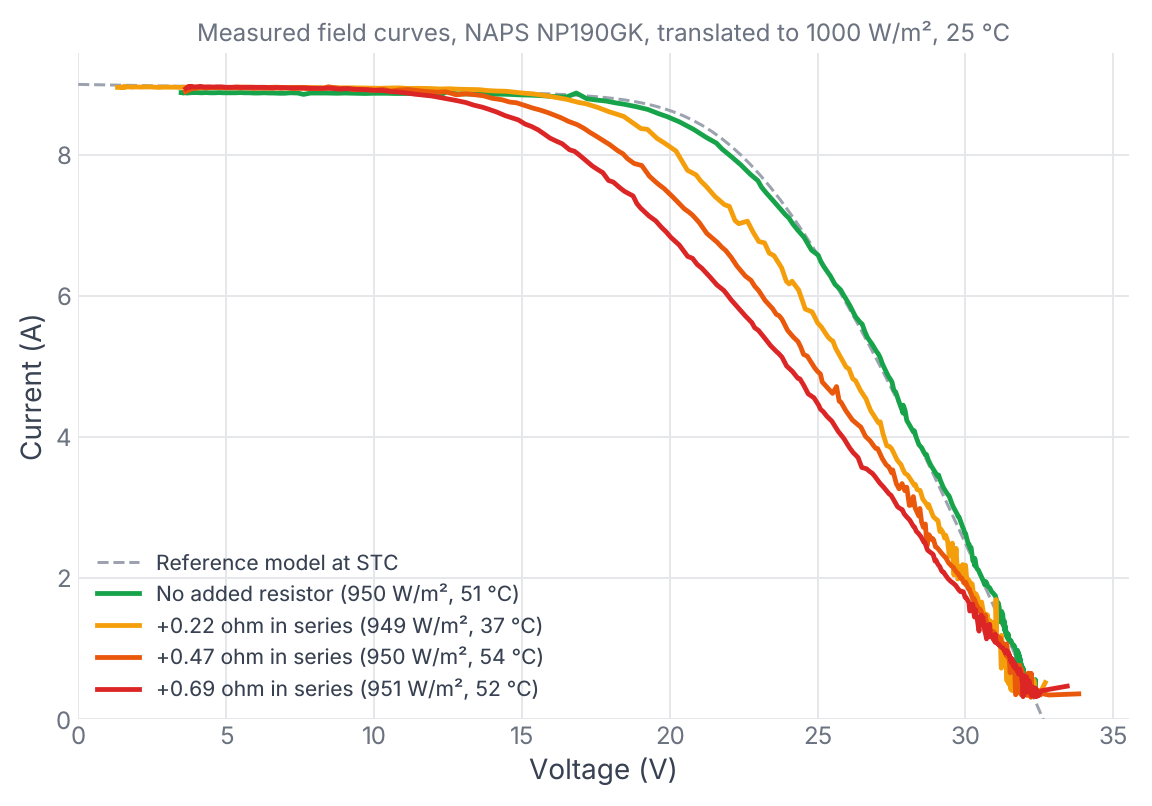
All four curves start at the same current, about 9.0 A at STC. All four end within a few tenths of a volt of each other at open circuit. Between those two points they split. Every amp that flows through 0.22 ohm drops 0.22 V across it, so the curve shifts left by more volts the more current it carries. The knee, where current is high and voltage is high, takes the biggest hit. The power point sits right on the knee.
That is the signature: fill factor down, Isc and Voc where they should be.
| Added in series (ohm) | Fill factor (% of model) | Pmp at STC (W) | Loss vs no resistor (%) |
|---|---|---|---|
| 0 | 99.8 | 176.9 | |
| 0.22 | 91.8 | 163.2 | 7.7 |
| 0.47 | 83.0 | 149.0 | 15.8 |
| 0.69 | 76.7 | 139.4 | 21.2 |
Medians over every curve taken at 900 W/m2 or more (304 healthy, 100 per resistor).
A quick estimate, and where it breaks
The fitted reference model puts the module's maximum-power current at 8.1 A at STC. A resistor in series with that current wastes I² x R:
- 0.22 ohm: 8.1² x 0.22 = 14.4 W, or 8.1 % of 179 W. Measured: 7.7 %.
- 0.47 ohm: 30.8 W, or 17.2 %. Measured: 15.8 %.
- 0.69 ohm: 45.3 W, or 25.2 %. Measured: 21.2 %.
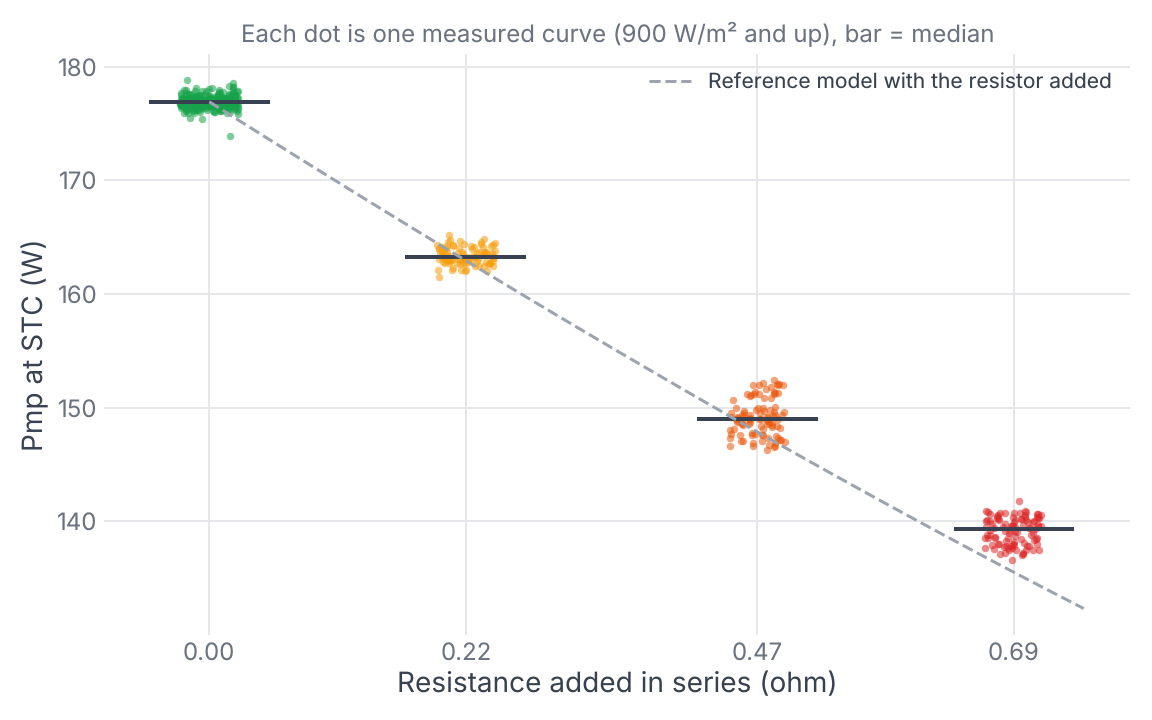
For a small addition, Imp² x R is a good first number to put in a field report. For a large one it overstates the loss. The power point moves to a lower current as resistance grows, and I² x R at a lower current is smaller. The single-diode model with the resistor added to its Rs captures most of that (dashed line), and lands within 2.2 points of the measured loss at 0.69 ohm.
For scale, the fitted Rs of the stand is 0.87 ohm, which covers the module, its cables and its connectors. So 0.22 ohm is a 25 % increase in total series resistance.
How the Analyzer reads it
The IV Data Analyzer translates each curve to STC, compares it to the reference model, and checks the shape. The series-resistance rule asks three things:
- Is the fill factor under the model?
- Are Isc and Voc still close to the model?
- Is the slope near short circuit normal? A steep slope there means a shunt path, which also lowers fill factor but bends the top-left corner of the curve instead of the knee.
On these measured curves:
- Resistor curves: series resistance named on 399 of 400. The one miss came back Indeterminate: a 0.22 ohm curve from the 9 August run, taken at 843 W/m2.
- Healthy curves: 0 of 570 named a fault, across this module and three other healthy modules in the same dataset. Curves under 400 W/m2 are sent to Retest instead of diagnosed. IEC 62446-1 sets the same floor.
What this means in the field
- A fill factor a few points under the model, with Isc and Voc on target, is worth chasing. At this module's current, every 0.1 ohm cost 3 to 3.5 % of STC power.
- In a string, connector and cable resistance adds up across every module. Trace the string, and if the knee is soft, trace module by module to find where it comes from.
- Check the slope near short circuit before calling it series resistance. A shunt problem (PID, moisture, cracked cells) also lowers fill factor and needs a different fix.
Limits
One module type, one test stand, sunny days in August. The reference model is fitted to this module's own healthy curves, so the comparison shows the change the resistor made, not how the module compares to its nameplate. Strings dilute the signal: one module with a bad connector in a 20-module string is too small to see on the string trace.